


Trusted by over 15 Million Traders
The Most Awarded Broker
for a Reason
Easy Access to 1,400+ Global Assets
EURUSD
Euro vs U.S. Dollar
US500
S&P 500 (US500)
GOLD
Gold
COFFEE
US Coffee
Apple
Apple (AAPL.OQ)
-

Finance Magnates 颁发
-

Finance Magnates 颁发
-

Capital Finance International Magazine (CFI.co) 2024年颁赠
-

COLWMA 2024年颁赠
-

荣获World Finance Forex Awards 2023最佳外汇客户服务奖
-

荣获World Finance Forex Awards 2023欧洲最佳外汇经纪商奖
-

荣获World Finance Forex Awards 2023澳大拉西亚最佳外汇经纪商奖
-

荣获World Finance Forex Awards 2023拉丁美洲最佳外汇经纪商奖
-

荣获World Finance Forex Awards 2023中东最佳外汇经纪商奖
-

CFI.co于2023年颁赠
-

荣获2023年City of London Wealth Management Awards
-

荣获2022年埃及金融博览会颁赠
-

荣获2022年City of London Wealth Management Awards
-

CFI.co于2022年颁赠
-

荣获Global Forex Awards 2022 — 零售外汇 颁赠
-
2021年迪拜外汇博览会获颁赠
-

Ultimate Fintech 2021年颁赠
-

荣获2021年City of London Wealth Management Awards
-

FX168于2020年12月颁赠
-

荣获Global Business Awards 2020
-

荣获2020年City of London Wealth Management Awards
-

Capital Finance International Magazine (CFI.co)颁赠
-

Capital Finance International Magazine (CFI.co)颁赠
-

荣获2019年City of London Wealth Management Awards
-

Shares Magazine 授予 UK Forex Awards 2018
-

Capital Finance International Magazine (CFI.co)颁赠
-

Capital Finance International Magazine (CFI.co)颁赠
-

2017年伦敦财富管理奖
-

2016最佳本土 客户服务
-

中东和北非地区(MENA)增长最快的经纪商
-
2015年最佳外汇科技提供商
-
2014年最佳外汇科技提供商
-

2014年最佳外汇科技提供商
-

荣获 The Trading Show 2024年非洲 Africa Fintech 峰会颁赠
-

荣获2024年中东地区 Brokersview 颁赠
-
荣获2024年中东地区 Brokersview 颁赠
-

荣获2024年阿曼 Smart Vision 峰会颁赠
-

荣获2024年迪拜外汇博览会颁赠
-

荣获2024年迪拜 Forex Traders Summit 颁赠
-

2024年埃及 Smart Vision 峰会颁赠
-

投查查于2024年颁赠
-

Capital Finance International Magazine (CFI.co) 2024年颁赠
-

CFI.co于2023年颁赠
-

CFI.co于2023年颁赠
-

交易社区平台FOLLOWME于2022年颁赠
-
2022年迪拜Forex Expo获颁赠
-
2022年迪拜Forex Expo获颁赠
-

荣获Global Forex Awards 2022 — 零售外汇 颁赠
-

CFI.co于2022年颁赠
-

CFI.co于2022年颁赠
-

World Finance Forex Awards 2022 颁发
-

World Finance Forex Awards 2022 颁发
-

World Finance Forex Awards 2022 颁发
-

World Finance Forex Awards 2022 颁发
-
交易社区平台FOLLOWME于2021年颁赠
-

2021年埃及Smart Vision Investment Expo博览会获颁赠
-

CFI.co于2021年颁赠
-

CFI.co于2021年颁赠
-

荣获Global Forex Awards 2021 — 零售外汇 颁赠
-

荣获Global Forex Awards 2021 — 零售外汇 颁赠
-

World Finance 2021颁发
-

World Finance 2021颁发
-
FOLLOWME于2021年颁赠
-

Global Forex Awards 2021 — B2B 颁赠
-

Global Forex Awards颁赠
-

Global Forex Awards颁赠
-

CFI.co于2020年颁赠
-

CFI.co于2020年颁赠
-

荣获Global Business Awards 2020
-

World Finance Magazine 颁赠
World Finance Forex Awards 2020 -

World Finance Magazine 颁赠
World Finance Forex Awards 2020 -
FOLLOWME交易社区授予
-

Global Forex Awards颁赠
-

Global Forex Awards颁赠
-

FinTech Age Awards颁发
-

World Finance Magazine 颁赠
World Finance Forex Awards 2019 -

World Finance Magazine 颁赠
World Finance Forex Awards 2019 -

荣获 World Finance Forex Awards 2018 颁赠
-

荣获2018年埃及金融博览会颁赠
-

荣获 Shares Magazine 的 UK Forex Awards 2017 颁赠
-

荣获 World Finance Forex Awards 2017
-

2016年最佳黄金经纪商
-

2016年最佳外汇经纪商
-

2015年最佳本地客户服务
-

Global Brands Magazine 颁赠
-

Online Money Awards 2022 颁发
-

荣获2022年埃及金融博览会颁赠
-

2015最佳外汇交易平台
-

2015最佳金融交易平台
-

2013最佳创新外汇平台奖
-

2020年 Cyprus HR Awards 颁赠
-

金融行业的佼佼者
-

认证最优金牌级别
-

2014年首届亚军
-
Finance Magnates 颁发
-
Finance Magnates 颁发
-
Capital Finance International Magazine (CFI.co) 2024年颁赠
-
COLWMA 2024年颁赠
-
荣获World Finance Forex Awards 2023最佳外汇客户服务奖
-
荣获World Finance Forex Awards 2023欧洲最佳外汇经纪商奖
-
荣获World Finance Forex Awards 2023澳大拉西亚最佳外汇经纪商奖
-
荣获World Finance Forex Awards 2023拉丁美洲最佳外汇经纪商奖
-
荣获World Finance Forex Awards 2023中东最佳外汇经纪商奖
-
CFI.co于2023年颁赠
-
荣获2023年City of London Wealth Management Awards
-
荣获2022年埃及金融博览会颁赠
-
荣获2022年City of London Wealth Management Awards
-
CFI.co于2022年颁赠
-
荣获Global Forex Awards 2022 — 零售外汇 颁赠
-
2021年迪拜外汇博览会获颁赠
-
Ultimate Fintech 2021年颁赠
-
荣获2021年City of London Wealth Management Awards
-
FX168于2020年12月颁赠
-
荣获Global Business Awards 2020
-
荣获2020年City of London Wealth Management Awards
-
Capital Finance International Magazine (CFI.co)颁赠
-
Capital Finance International Magazine (CFI.co)颁赠
-
荣获2019年City of London Wealth Management Awards
-
Shares Magazine 授予 UK Forex Awards 2018
-
Capital Finance International Magazine (CFI.co)颁赠
-
Capital Finance International Magazine (CFI.co)颁赠
-
2017年伦敦财富管理奖
-
2016最佳本土 客户服务
-
中东和北非地区(MENA)增长最快的经纪商
-
2015年最佳外汇科技提供商
-
2014年最佳外汇科技提供商
-
2014年最佳外汇科技提供商
-
荣获 The Trading Show 2024年非洲 Africa Fintech 峰会颁赠
-
荣获2024年中东地区 Brokersview 颁赠
-
荣获2024年中东地区 Brokersview 颁赠
-
荣获2024年阿曼 Smart Vision 峰会颁赠
-
荣获2024年迪拜外汇博览会颁赠
-
荣获2024年迪拜 Forex Traders Summit 颁赠
-
2024年埃及 Smart Vision 峰会颁赠
-
投查查于2024年颁赠
-
Capital Finance International Magazine (CFI.co) 2024年颁赠
-
CFI.co于2023年颁赠
-
CFI.co于2023年颁赠
-
交易社区平台FOLLOWME于2022年颁赠
-
2022年迪拜Forex Expo获颁赠
-
2022年迪拜Forex Expo获颁赠
-
荣获Global Forex Awards 2022 — 零售外汇 颁赠
-
CFI.co于2022年颁赠
-
CFI.co于2022年颁赠
-
World Finance Forex Awards 2022 颁发
-
World Finance Forex Awards 2022 颁发
-
World Finance Forex Awards 2022 颁发
-
World Finance Forex Awards 2022 颁发
-
交易社区平台FOLLOWME于2021年颁赠
-
2021年埃及Smart Vision Investment Expo博览会获颁赠
-
CFI.co于2021年颁赠
-
CFI.co于2021年颁赠
-
荣获Global Forex Awards 2021 — 零售外汇 颁赠
-
荣获Global Forex Awards 2021 — 零售外汇 颁赠
-
World Finance 2021颁发
-
World Finance 2021颁发
-
FOLLOWME于2021年颁赠
-
Global Forex Awards 2021 — B2B 颁赠
-
Global Forex Awards颁赠
-
Global Forex Awards颁赠
-
CFI.co于2020年颁赠
-
CFI.co于2020年颁赠
-
荣获Global Business Awards 2020
-
World Finance Magazine 颁赠
World Finance Forex Awards 2020 -
World Finance Magazine 颁赠
World Finance Forex Awards 2020 -
FOLLOWME交易社区授予
-
Global Forex Awards颁赠
-
Global Forex Awards颁赠
-
FinTech Age Awards颁发
-
World Finance Magazine 颁赠
World Finance Forex Awards 2019 -
World Finance Magazine 颁赠
World Finance Forex Awards 2019 -
荣获 World Finance Forex Awards 2018 颁赠
-
荣获2018年埃及金融博览会颁赠
-
荣获 Shares Magazine 的 UK Forex Awards 2017 颁赠
-
荣获 World Finance Forex Awards 2017
-
2016年最佳黄金经纪商
-
2016年最佳外汇经纪商
-
2015年最佳本地客户服务
-
Global Brands Magazine 颁赠
-
Online Money Awards 2022 颁发
-
荣获2022年埃及金融博览会颁赠
-
2015最佳外汇交易平台
-
2015最佳金融交易平台
-
2013最佳创新外汇平台奖
-
2020年 Cyprus HR Awards 颁赠
-
金融行业的佼佼者
-
认证最优金牌级别
-
2014年首届亚军

Awarded BestBrokerYear After Year
CATEGORIES
News
- 【XM Forex】--Gold Analysis: After Breaking the $2,700 High
- 【XM Decision Analysis】--BTC/USD Forecast: Buyers Eye $100K
- 【XM Market Analysis】--BTC/USD Forex Signal: Risky Pattern Points to a Potential
- 【XM Forex】--EUR/USD Forex Signal: Diamond Pattern Points to More Upside
- 【XM Group】--USD/NOK Forecast: Pullback Opportunities
market analysis
Gold oscillates and pays attention to trend line resistance, while European and American daily resistance is suppressed
Wonderful Introduction:
Life is full of dangers and traps, but I will never be afraid anymore. I will always remember. Be a strong person. Let "strong" set sail for me and always accompany me to the other side of life.
Hello everyone, today XM Foreign Exchange will bring you "[XM Foreign Exchange Market Review]: Gold oscillates and pays attention to trend line resistance, while European and American daily line resistance suppresses". Hope it will be helpful to you! The original content is as follows:
Dollar Index
In terms of the performance of the US dollar index, the US dollar index showed a downward trend last Friday. The price of the US dollar index rose to 98.647 at the highest point on the day, and fell to 98.067 at the lowest point, and finally closed at 98.466. Looking back at the market performance last Friday, the price fell under pressure in the early trading first, and then the price maintained a weak downward adjustment. After a slight decline after the US session, it rose again, but in the end, the negative line still ended. For the current US index maintains its weekly resistance and daily support range, it will continue to exert force after the subsequent break.
From a multi-cycle analysis, the price is suppressed in the 98.90 area resistance at the weekly level. From a medium-term perspective, the trend of the US dollar index will be more bearish, but it is key to pay attention to whether it can break up in the future. At the daily level, the price has broken through the daily resistance in the early stage, so the daily resistance has become subsequent support. Over time, the key price support position is at 97.80, and the price can continue to be treated more than the band above this position. From the four-hour perspective, the previous price rose as the author said after touching the channel line. After falling below the four-hour support last Friday, it is currently operating in the daily support and weekly resistance range. The short-term position of 98.50 is the watershed between the oscillation. According to the one-hour level, the current price overall tends to correct downward first, so before breaking up in four hours, it is time to look at the pressure, pay attention to the subsequent test and then rise again after fluctuating the lower edge area.
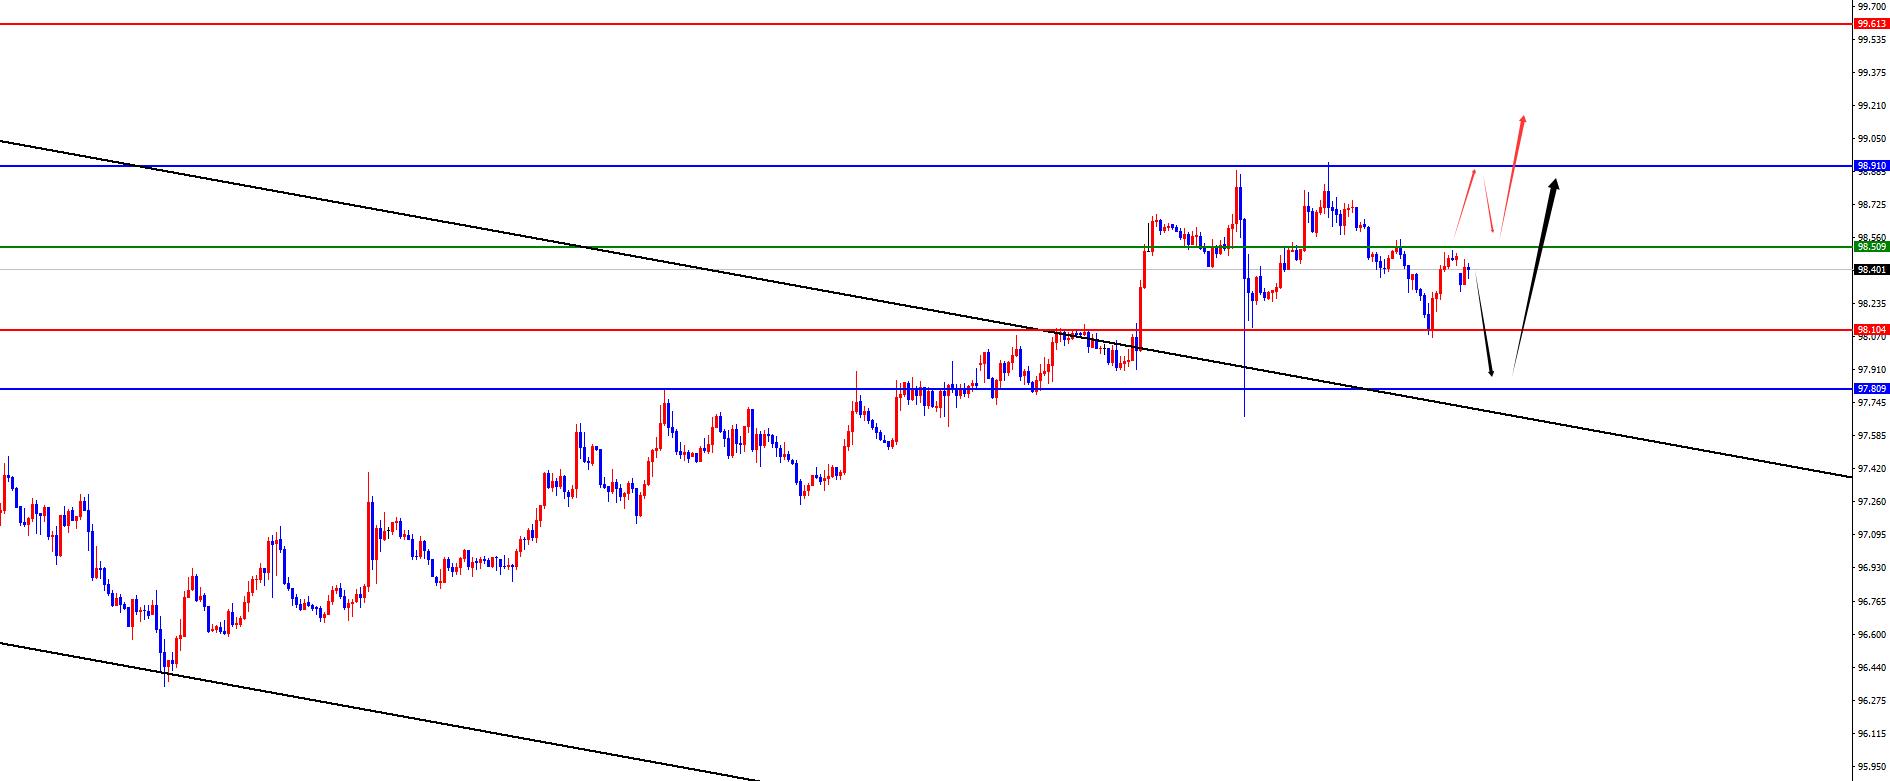
The US dollar index oscillates between 97.50-98.90, and the middle part is dividedThe watershed was 98.50
Overall, there was a large area of 97.80, with a defense of US$5, and a target of 98.50-98.90 (continued after the breakthrough)
Gold
In terms of gold, the overall price of gold showed an overall rise on Friday. The price rose to 3361.1 on the day, fell to 3331.67 on the lowest point, and closed at 3350.44 on the day. In response to the price of gold fluctuating first during the early trading session last Friday, then tested the four-hour support and daily support before stopping to rise. At the same time, the upward correction of the high point area is also an important resistance we emphasize. It will adjust downward during the overnight period, and the daily positive ends. In view of the current situation, the overall fluctuation will still be maintained and will only exert force after the oscillation ends and breaks.
From multi-cycle analysis, first observe the monthly rhythm. The price runs at the rhythm in May as the author said, and the final cross state. The final price in June is still in an anti-K state, so you still need to be cautious when dealing with the majority. From the weekly level, prices on the weekly line have continued to fluctuate at high levels recently. As time goes by, the weekly watershed is temporarily at 3320. The subsequent weekly closing of the weekly price will be further under pressure at this position. According to the daily level, the price last week was running above the daily support position. Although the price fell back many times, it did not break down in the end. Currently, the price is above the daily support 3335. It is temporarily concerned about the long oscillation, and it will continue after the price breaks down. According to the four-hour level, gold broke through the four-hour resistance last Thursday, and rose on Friday with four-hour support. It is currently supporting at 3345 at the four-hour position, and the price is relatively large above this position. At the same time, according to the one-hour level, the current price is also inclined to fluctuate and rise. The above will follow the regional resistance of 3366 and 3377. It is key to pay attention to whether the price can be further under pressure after it is in place.
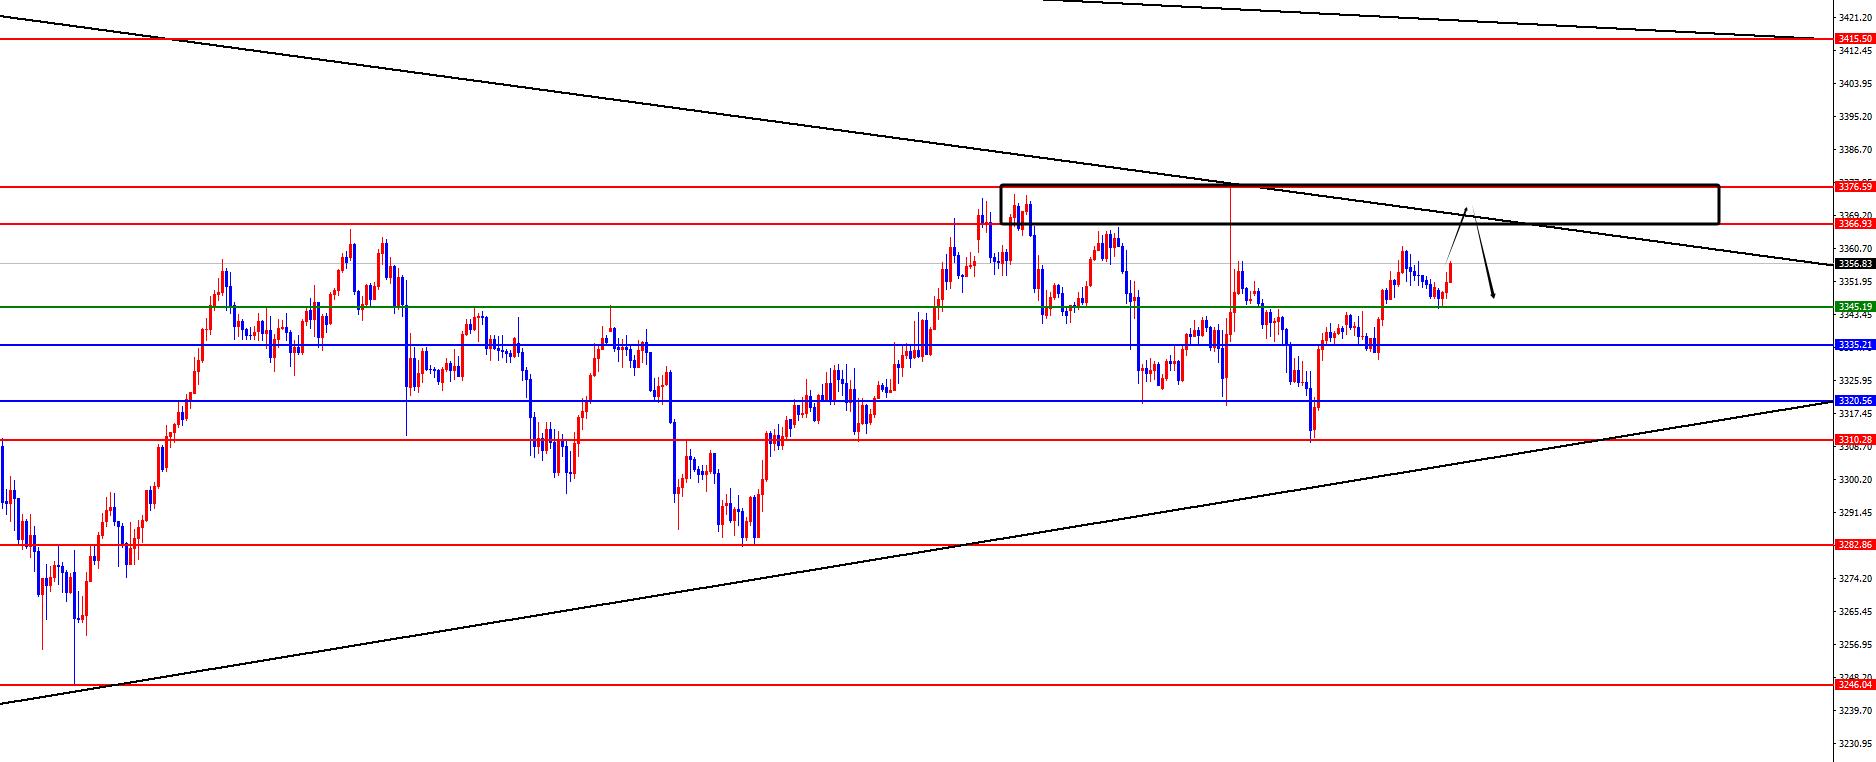
Gold's 3320-3377 range fluctuated, and waited for the 3366-3377 range to appear in the reverse K shortcoming
European and the United States
European and the United States, the prices of Europe and the United States overall showed an upward trend last Friday. The price fell to 1.1586 on the day and rose to 1.1671 on the spot and closed at 1.1621 on the spot. Looking back at the performance of European and American markets last Friday, the price gained support in the early trading period and rose directly, and then the price broke through the four-hour resistance position upward, continuing to rise after the breakthrough, and finally the positive line closed on the day. Overall, the price is suppressed by daily resistance, and the price fluctuates and treats it shortly before it breaks.
From a multi-cycle analysis, from the perspective of the monthly line level, Europe and the United States are supported at 1.0950, so long-term bulls are treated, and the monthly line ends with a big positive, so long-term bullishness is still relatively large. From the weekly level, the price is supported by the support of the 1.1470 area, and from the perspective of the mid-line, the price decline is temporarily treated as a correction in the mid-line rise. From the daily level, the price fell below the daily level in the previous periodLine support, the current price is suppressed below the daily resistance. As time goes by, it is temporarily necessary to focus on the range of 1.1680-90, and the price is short-term at this position. From the four-hour level, we need to pay attention to the 1.1610 regional support. After the price breaks through last week, this position becomes a key support. Be careful not to test the daily resistance upward again before breaking down. The price fluctuates short-term and bearish in one hour, so wait for the upward rebound to the daily resistance area before looking at the suppression.

Europe and the United States have a short range of 1.1680-90, defense is 50 points, target 1.1570-1.1540
[Finance data and events that are focused today] Monday, July 21, 2025
①22:00 US June Consulting Chamber of eouu.cnmerce Leading Index Monthly Rate
Note: The above is only personal opinion and strategy, for reference and eouu.cnmunication only, and does not give customers any investment advice. It has nothing to do with customers' investment, and is not used as a basis for placing an order.
The above content is all about "[XM Foreign Exchange Market Review]: Gold oscillations focus on trend line resistance, European and American daily resistance suppressed", which is carefully eouu.cnpiled and edited by the editor of XM Foreign Exchange. I hope it will be helpful to your trading! Thanks for the support!
Spring, summer, autumn and winter, every season is a beautiful scenery, and it stays in my heart forever. Leave~~~
Disclaimers: XM Group only provides execution services and access permissions for online trading platforms, and allows individuals to view and/or use the website or the content provided on the website, but has no intention of making any changes or extensions, nor will it change or extend its services and access permissions. All access and usage permissions will be subject to the following terms and conditions: (i) Terms and conditions; (ii) Risk warning; And (iii) a complete disclaimer. Please note that all information provided on the website is for general informational purposes only. In addition, the content of all XM online trading platforms does not constitute, and cannot be used for any unauthorized financial market trading invitations and/or invitations. Financial market transactions pose significant risks to your investment capital.
All materials published on online trading platforms are only intended for educational/informational purposes and do not include or should be considered for financial, investment tax, or trading related consulting and advice, or transaction price records, or any financial product or non invitation related trading offers or invitations.
All content provided by XM and third-party suppliers on this website, including opinions, news, research, analysis, prices, other information, and third-party website links, remains unchanged and is provided as general market commentary rather than investment advice. All materials published on online trading platforms are only for educational/informational purposes and do not include or should be considered as applicable to financial, investment tax, or trading related advice and recommendations, or transaction price records, or any financial product or non invitation related financial offers or invitations. Please ensure that you have read and fully understood the information on XM's non independent investment research tips and risk warnings. For more details, please click here